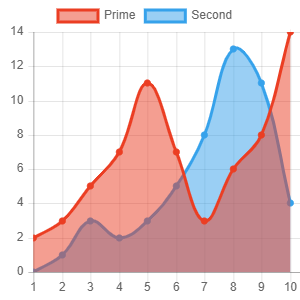
Chart.js の折れ線グラフのサンプルで、バージョン2.1.4で動作するシンプルなサンプルが軽く検索してなかったのでメモ用に貼っておきます。以下が実行結果で描画された折れ線グラフです。
以下が上記のグラフを描画しているHTMLとJavaScriptです。CDN版なのでコピペすれば動くと思います。
<script src="https://ajax.googleapis.com/ajax/libs/jquery/1.11.2/jquery.min.js" type="text/javascript"></script>
<script src="https://cdnjs.cloudflare.com/ajax/libs/Chart.js/2.1.4/Chart.bundle.min.js"></script>
<div style='width:300px;height:300px;text-align:center'><canvas id="myChart" width="300" height="300"></canvas></div>
<script>
var ctx = document.getElementById("myChart").getContext('2d');
var data = {
    labels: [1, 2, 3, 4, 5, 6, 7, 8, 9, 10],
    datasets: [
        {
            label: "Prime",
            backgroundColor: Chart.helpers.color('rgb(235, 62, 35)').alpha(0.5).rgbString(),
            borderColor: 'rgb(235, 62, 35)',
            pointBackgroundColor: 'rgb(235, 62, 35)',
            data: [2, 3, 5, 7, 11, 7, 3, 4, 8, 14]
        },
        {
            label: "Second",
            backgroundColor: Chart.helpers.color('rgb(54, 162, 235)').alpha(0.5).rgbString(),
            borderColor: 'rgb(54, 162, 235)',
            pointBackgroundColor: 'rgb(54, 162, 235)',
            data: [0, 1, 3, 2, 3, 5, 8, 13, 11, 4]
        }
    ]
};
var myLineChart = new Chart(ctx, {
  type: 'line',
  data: data,
  options: {}
});
</script>
![[jQuery] Select2 の選択ボックスの文字列のスタイルをカスタマイズする](/blog/images/DefaultThumbs/JavaScript.png)


